Live dashboards that turn project data into decisions
Track your income, profits, and future earnings in one place. See the numbers clearly so you can make the right choices for your business.
Trusted by professional services firms worldwide


.svg)


Reporting that helps you plan smarter
Gain detailed insights to stay in control of your projects. Make decisions backed by real-time data and comprehensive reports.
Forecast budgets
Surface bottlenecks
Prioritise profitable work
Plan workloads accurately
Catch overruns early
All Your Key Metrics in One Place
Catch Over-Servicing and Margin Risks Early

Reporting That Connects Resources to Results


Plan Ahead With the Full Picture

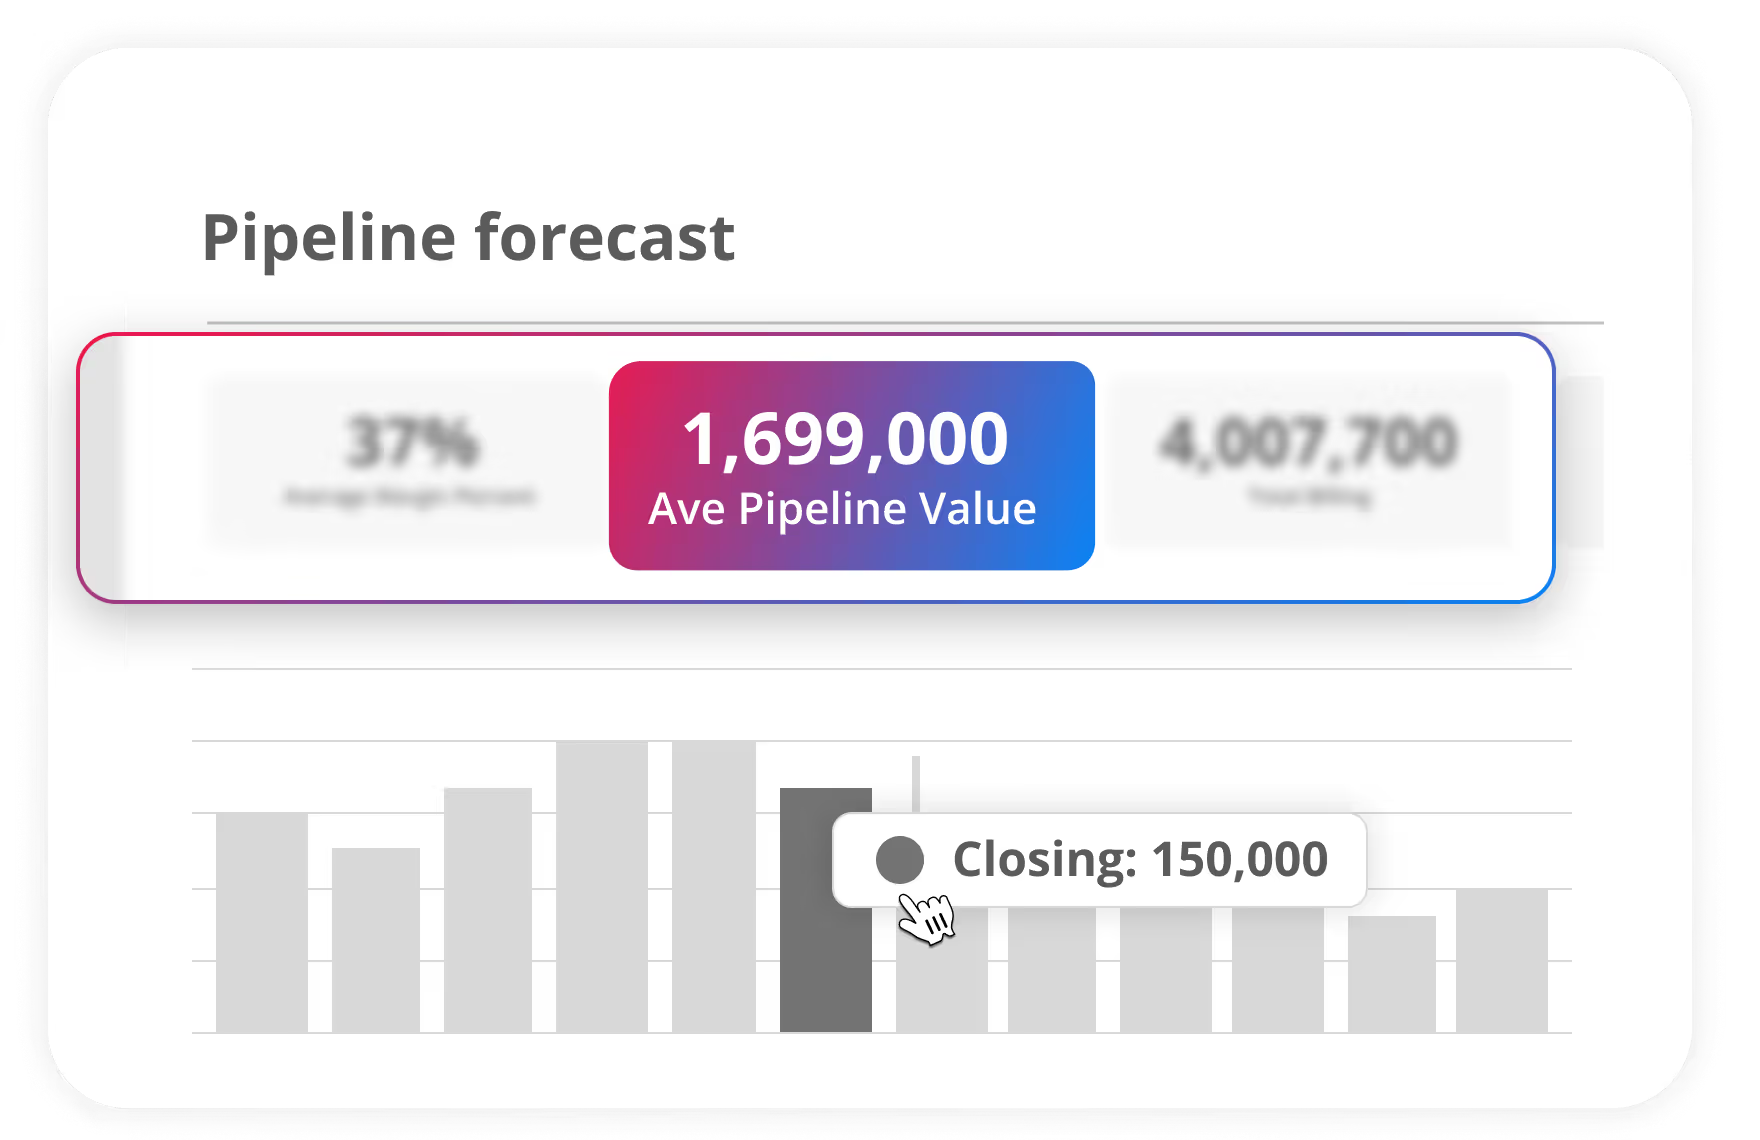
Pipeline Forecasting
Track incoming opportunity value by client or owner, including weighted forecasts by close probability
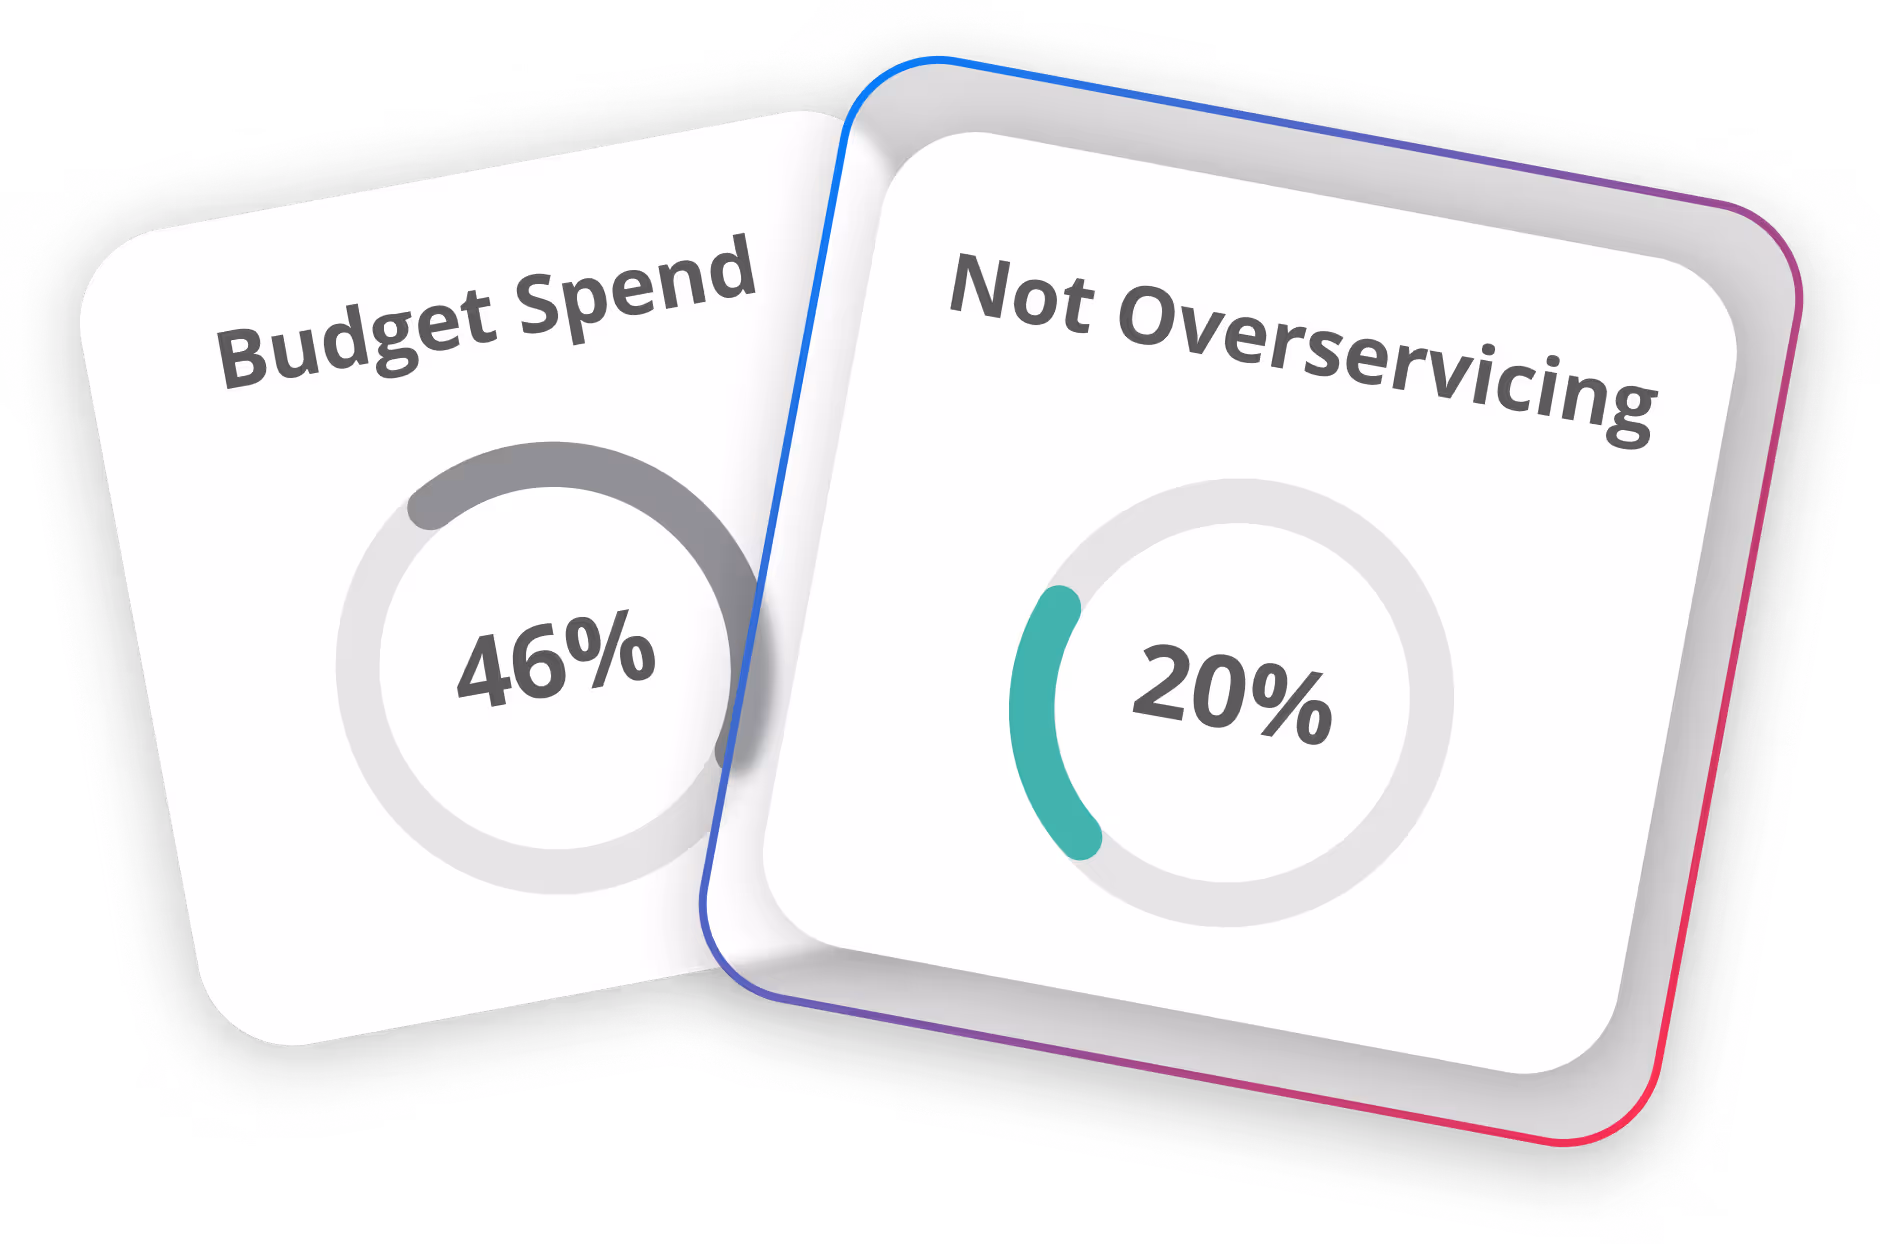
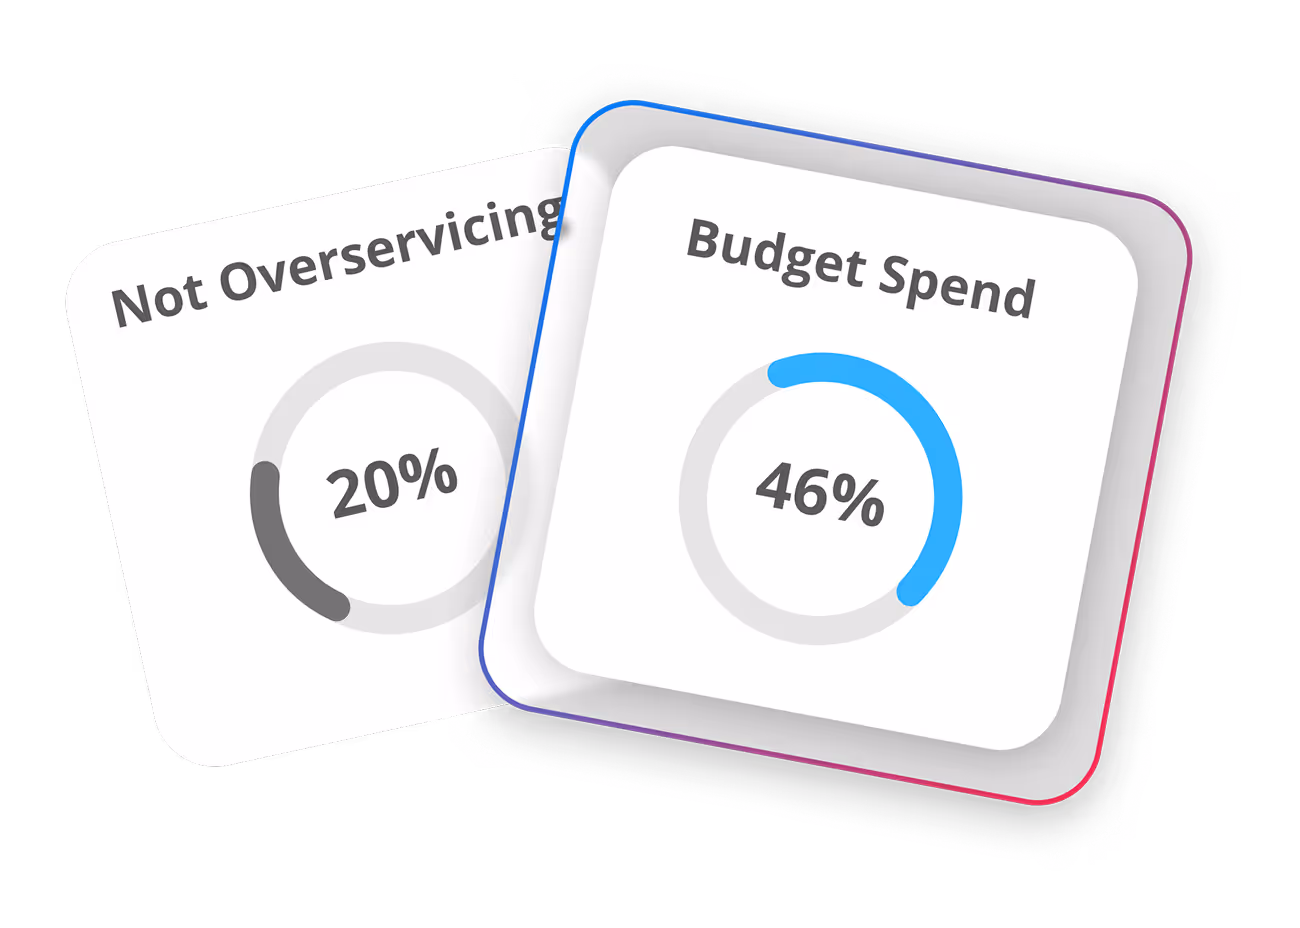
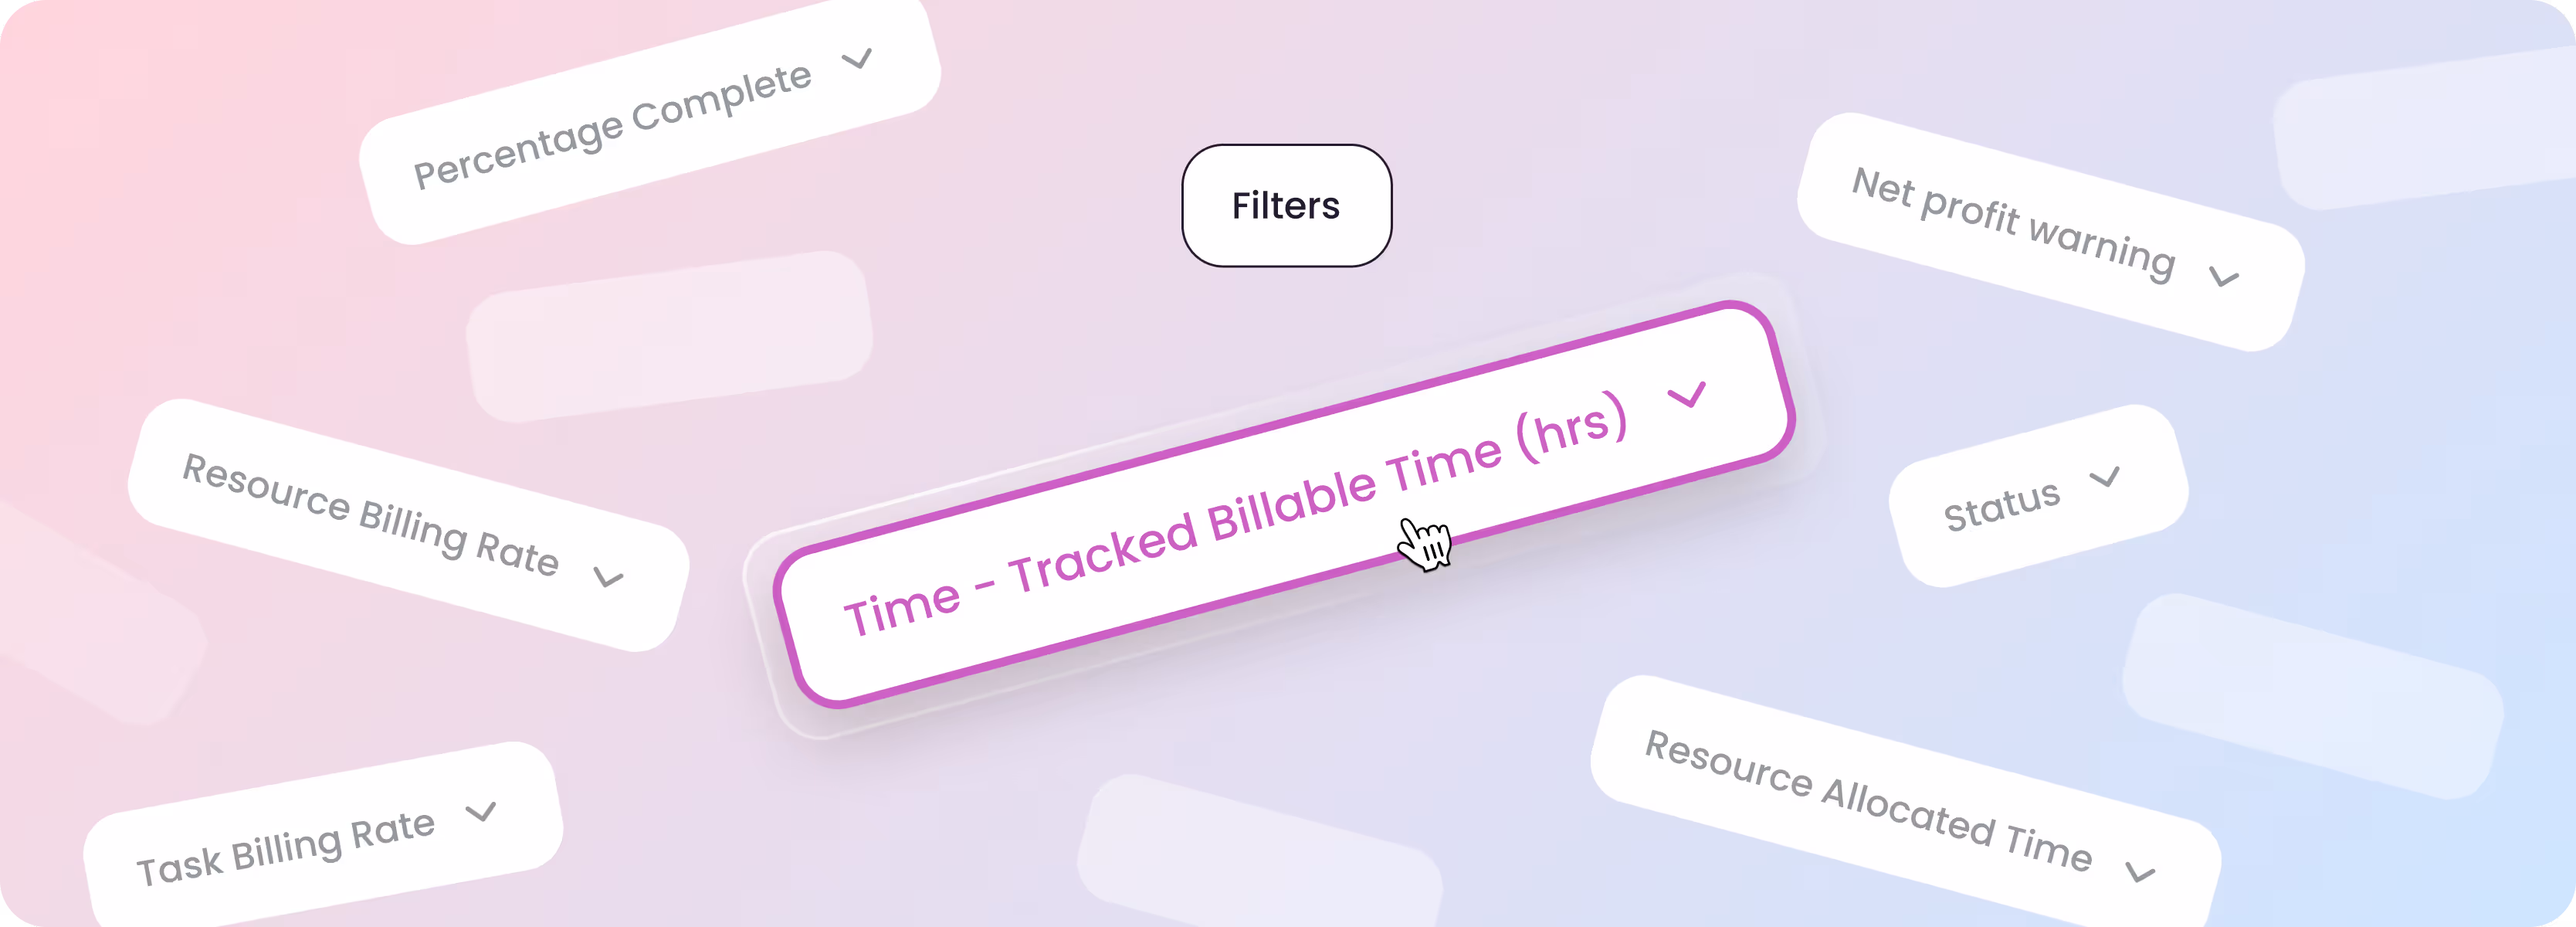
Overservicing Dashboards
Compare scheduled vs. tracked hours, measure budget usage and flag overservicing in real-time
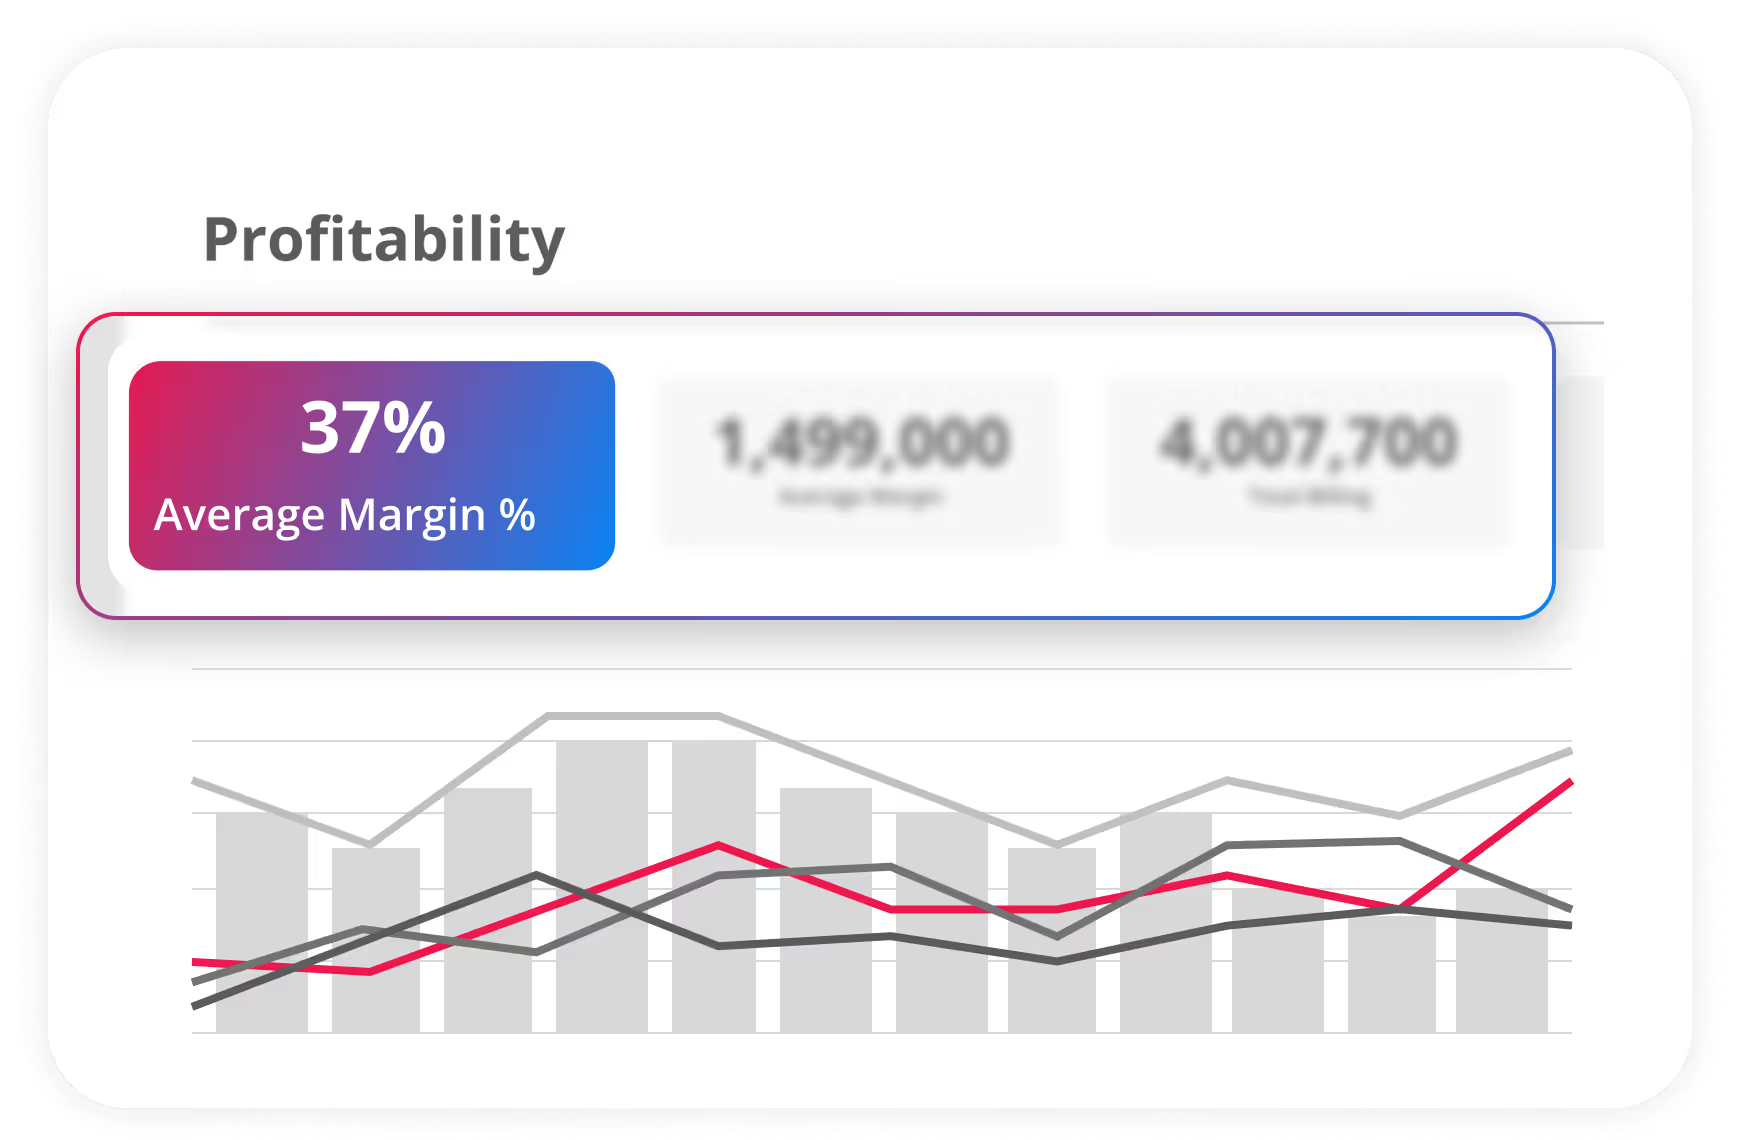
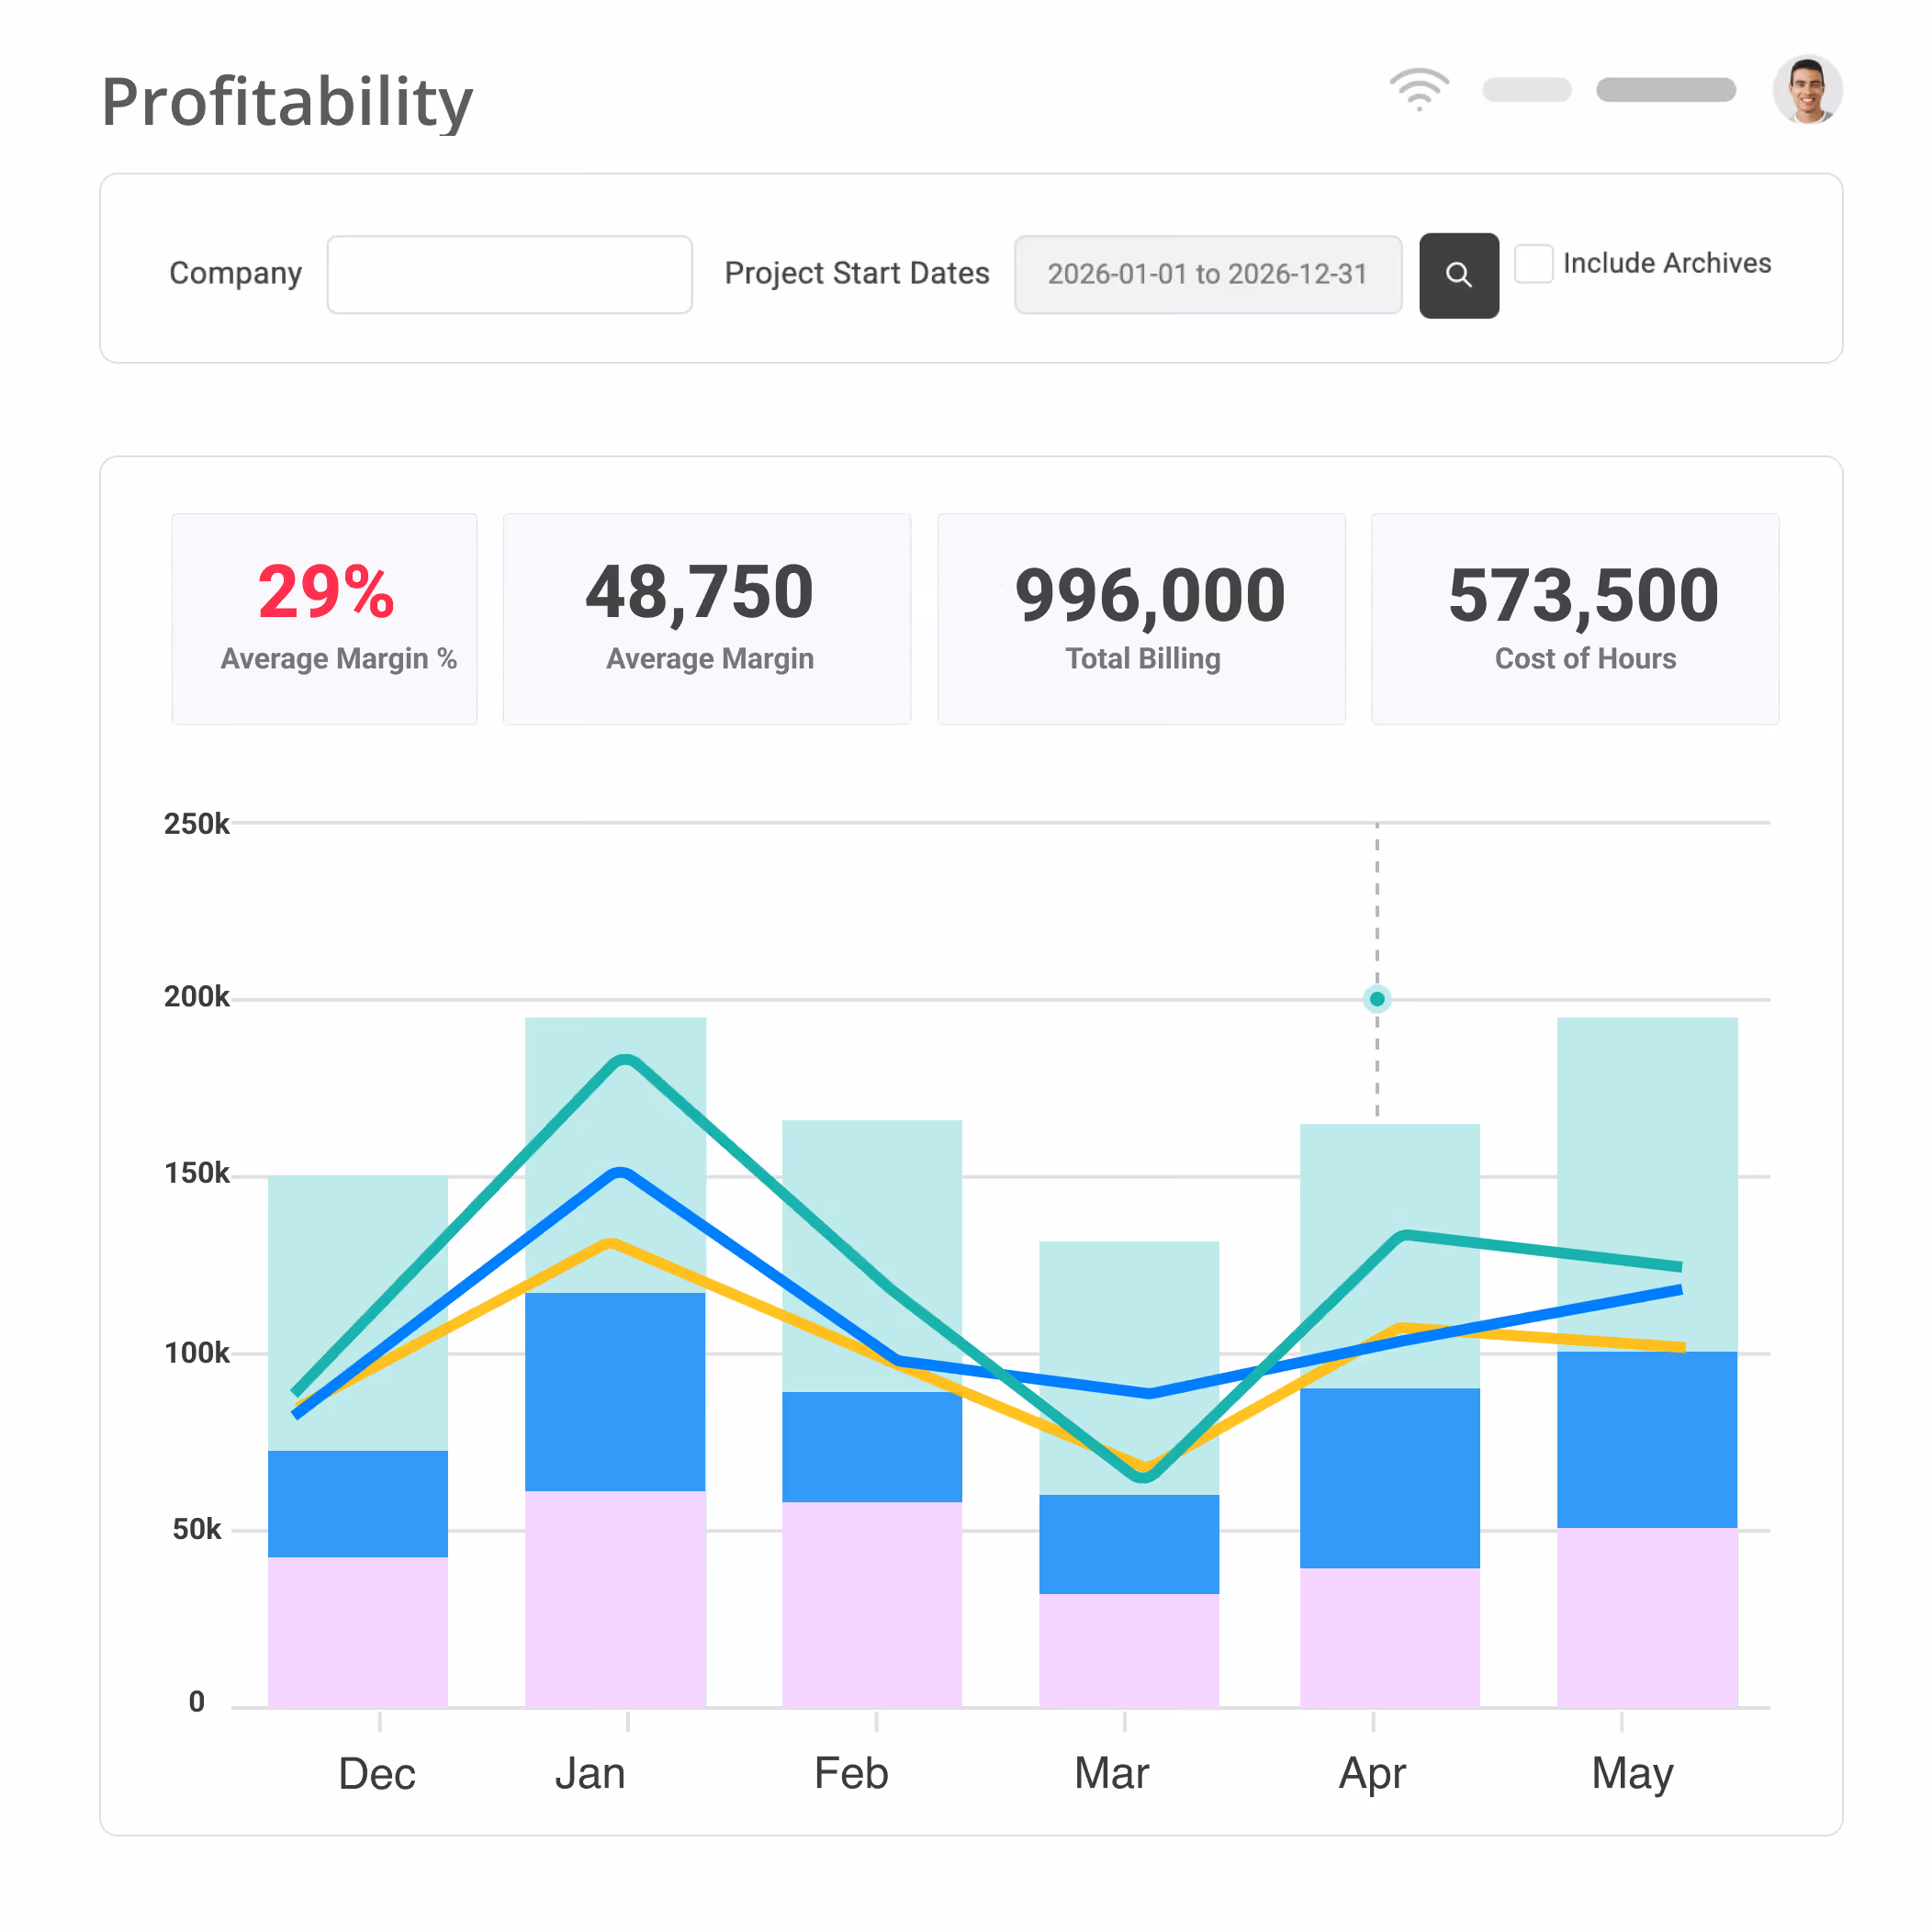
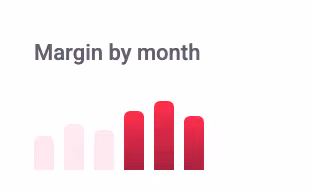
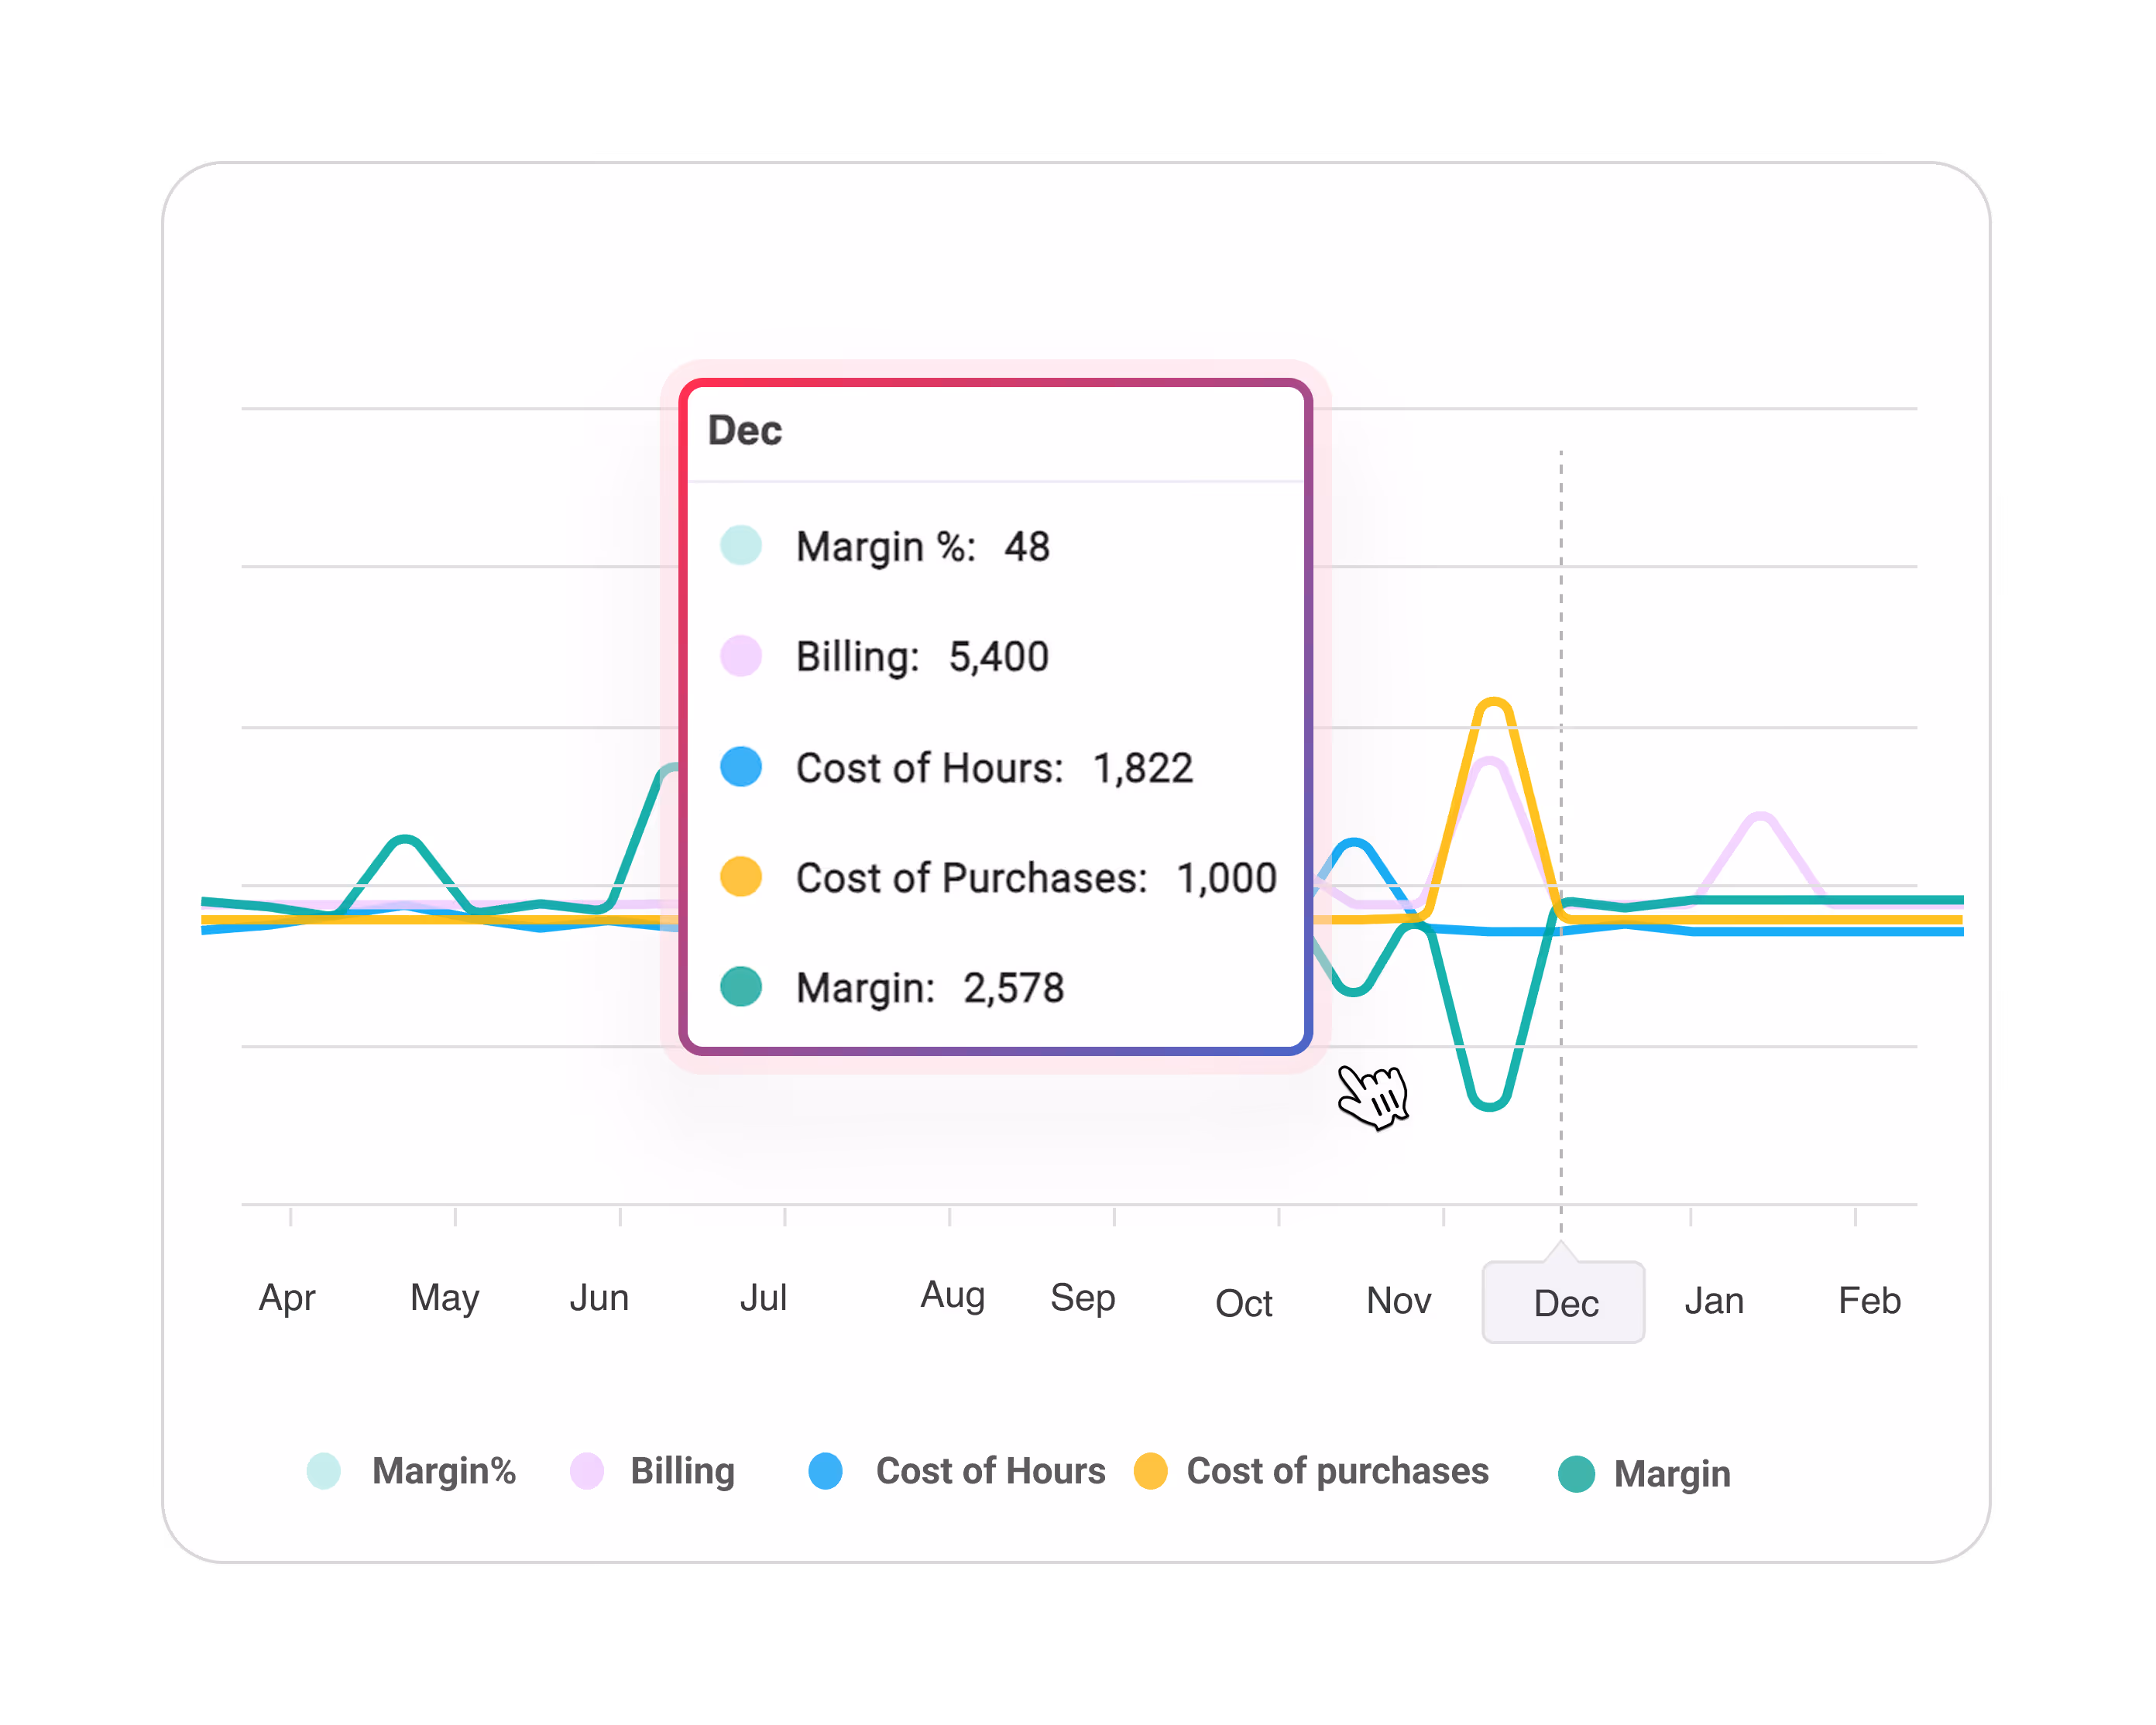
Profitability Reporting
See exactly how much each client, project or team member contributes to your margins.
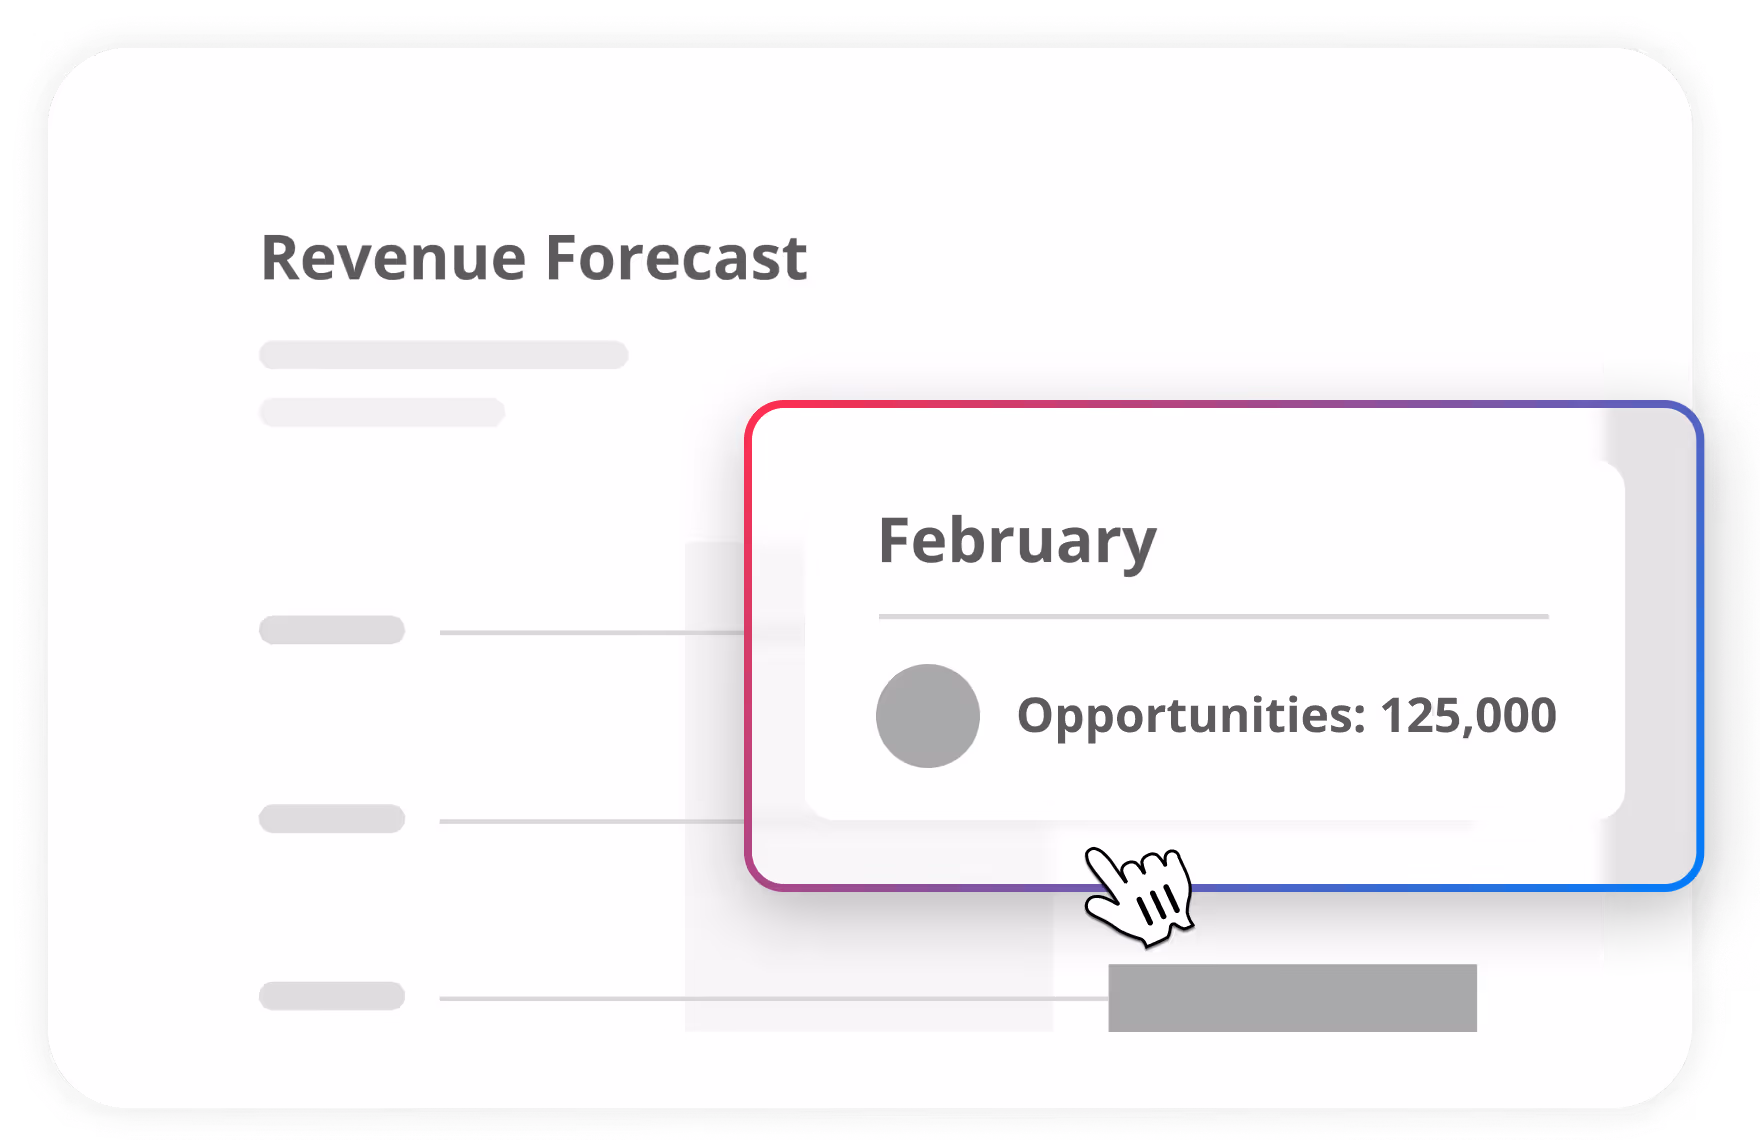
Revenue Forecasting
Forecast income across clients and projects with data pulled from CE's, billing schedules & opportunities.
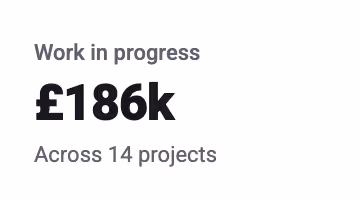
WIP Reporting (WIP)
Track work that has been delivered but not yet invoiced. Understand WIP value and aging per client for better revenue recognition.
Average Hourly Rate (AHR)
See the true value of work in progress and unbilled time at a glance. Stay on top of project profitability and improve cash flow predictability.
Customer Acquisition Costs (CAC)
Track the full cost of winning new customers, including time, expenses and input. Make smarter decisions and optimise for lifetime value.
Timesheet Completion Reports
Understand how delivery billing and payments affect your firms financial health in real time. Make adjustments to keep your business cash-positive.
Custom Reporting Built for Every Role
For Finance Teams
For Executives
Magnetic gives every role the exact insights they need - from live project timelines to margin control and team capacity - without digging through irrelevant data or juggling spreadsheets.
Get the business insights you need with custom dashboards
What Magnetic replaces
When reporting is an afterthought, buried in spreadsheets or locked in disconnected tools, decision-making slows down. Magnetic gives you real-time visibility across every part of your business, from project progress to team performance, so you can act faster, with confidence.
Magnetic gives you
Generic tools
How Happy Friday improved reporting accuracy and cut admin by 30%
From duplicated tasks and scattered time tracking to a streamlined, scalable system, Magnetic gave Happy Friday the clarity and control to grow without getting buried in admin.

Connect Magnetic with your existing tech stack
Magnetic integrates with your CRM, accounting, and other core systems, so data flows smoothly and teams work in sync. Need more? Use Zapier to plug into hundreds of other tools, fast.


.svg)


…and 400+ more apps through Zapier.
Explore all integrations →Magnetic has been an excellent choice for us. The system is easy to use and meets all of our tracking needs perfectly. I really appreciate that it’s customised to our specific requirements, which makes our workflows so much smoother.
"Significant time savings"
"Helps internal processes flow smoothly"

Your next reporting cycle should take minutes, not days
Start a free 14-day free trial. No credit card required. See why hundreds of professional services firms trust Magnetic for the reports their business runs on.
Get started for freeFree for 14 days | No credit card required